
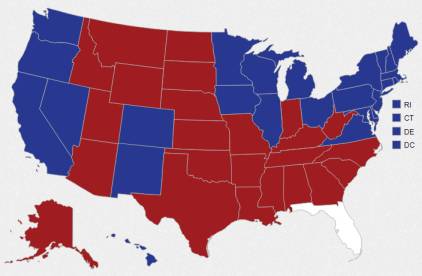
Election Maps – “Why Is the Map All Red if Obama Won?”
This isn’t in any way a political post, it is just a reflection on how the visual display of information impacts out perception. Look at the image above; it might seem inaccurate to say, based on the image, that ‘most of the country voted for Romney’. But that image is based on land mass, and since our country isn’t uniformly populated, that graph doesn’t really serve the intended informational purpose. Some people might only care about the basic result, such as this one from the New York Times: Others are looking for more, such as the margin of victory for…